Batch plot SME Scope 1 & 2 emissions
batch_sme_plots(data, output_path = NULL)Arguments
Value
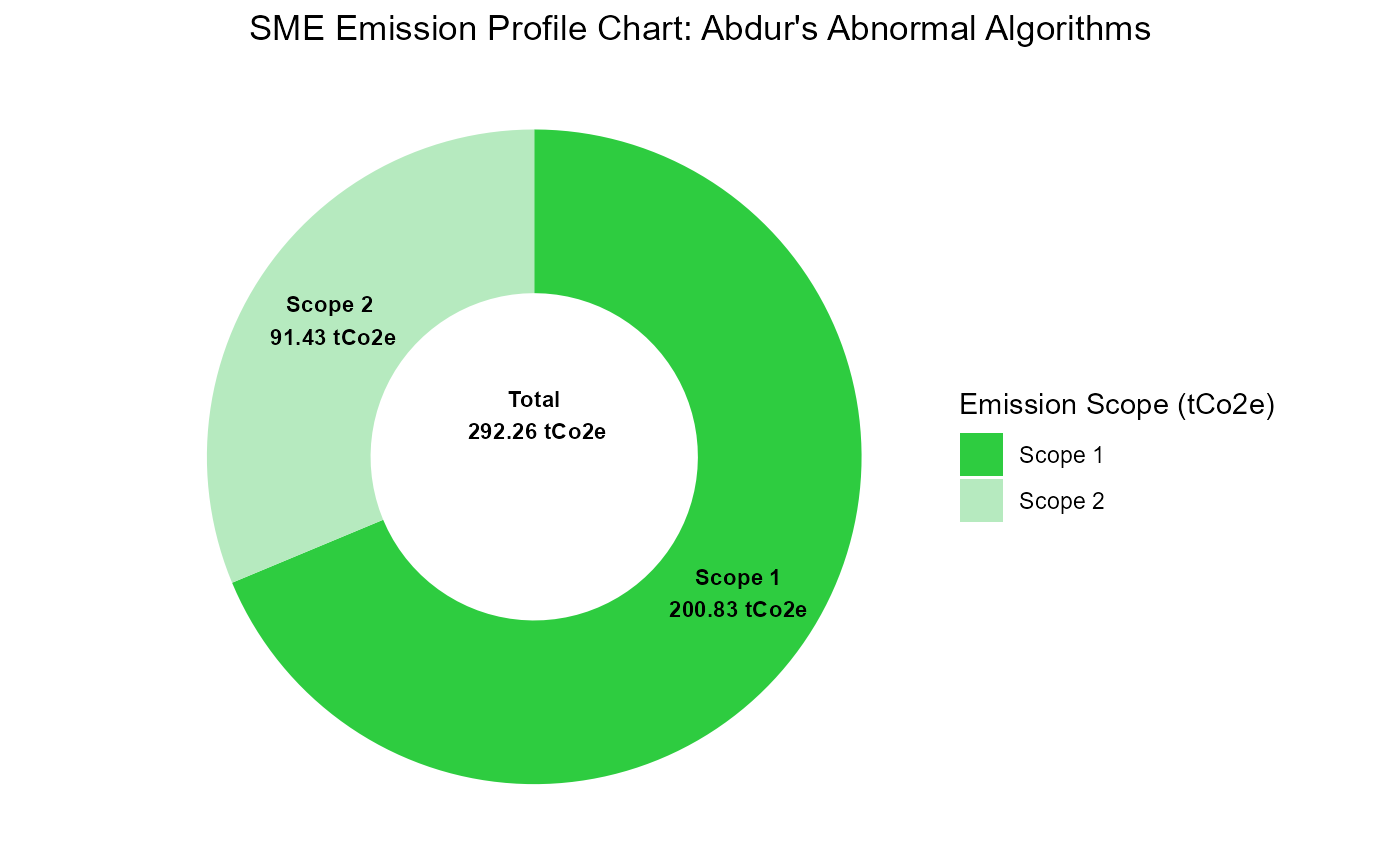
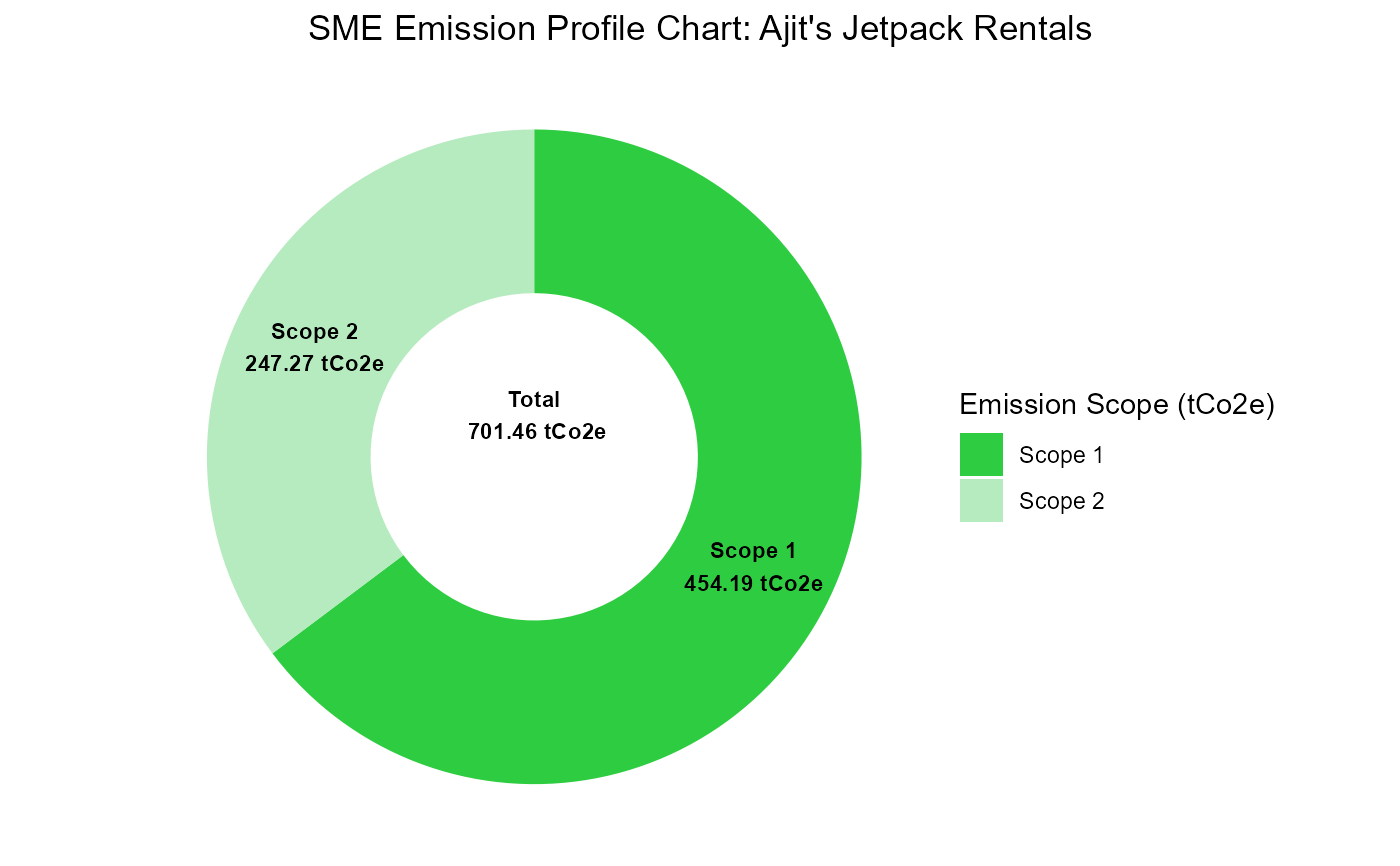
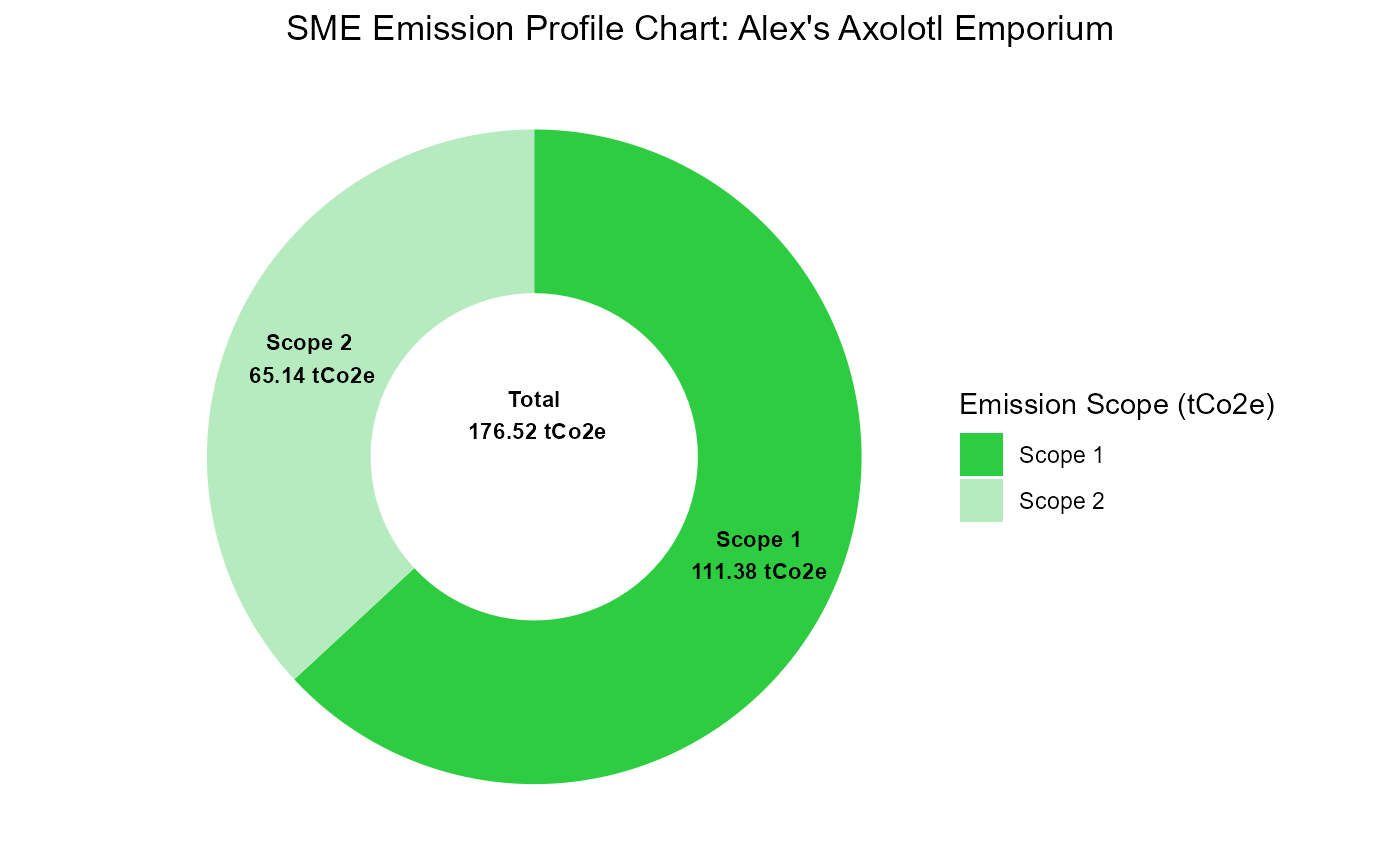
Donut chart plots showing scope 1 and 2 predicted emissions (in tCo2e) for each row in the data. Optionally saved to a directory as PNG files.
Examples
sample_data <- read.csv(system.file("extdata", "sme_examples.csv", package = "carbonpredict"))
sample_data <- head(sample_data, 3)
batch_sme_emissions <- batch_predict_emissions(
data = sample_data,
company_type = "sme",
output_path = NULL)
batch_sme_plots(data = batch_sme_emissions, output_path = NULL)