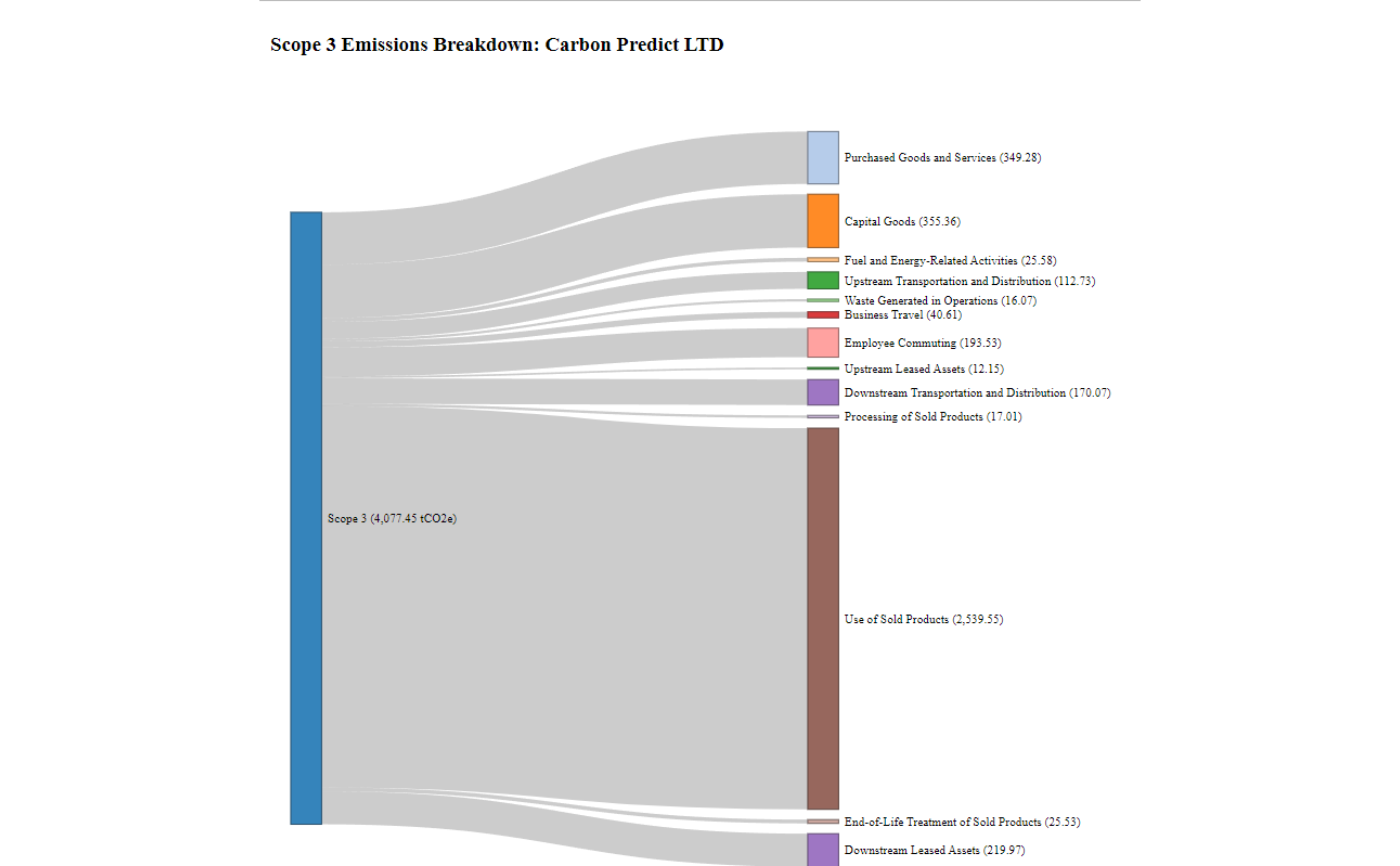
Plots a Sankey diagram showing the breakdown of Scope 3 emissions by category.
plot_scope3_emissions(scope3_df, company_name = NULL)Arguments
Value
A Sankey plot showing a breakdown for predicted emissions of each Scope 3 category.
Examples
scope3_df <- sme_scope3(85, 12000000)
plot_scope3_emissions(scope3_df, company_name = "Carbon Predict LTD")