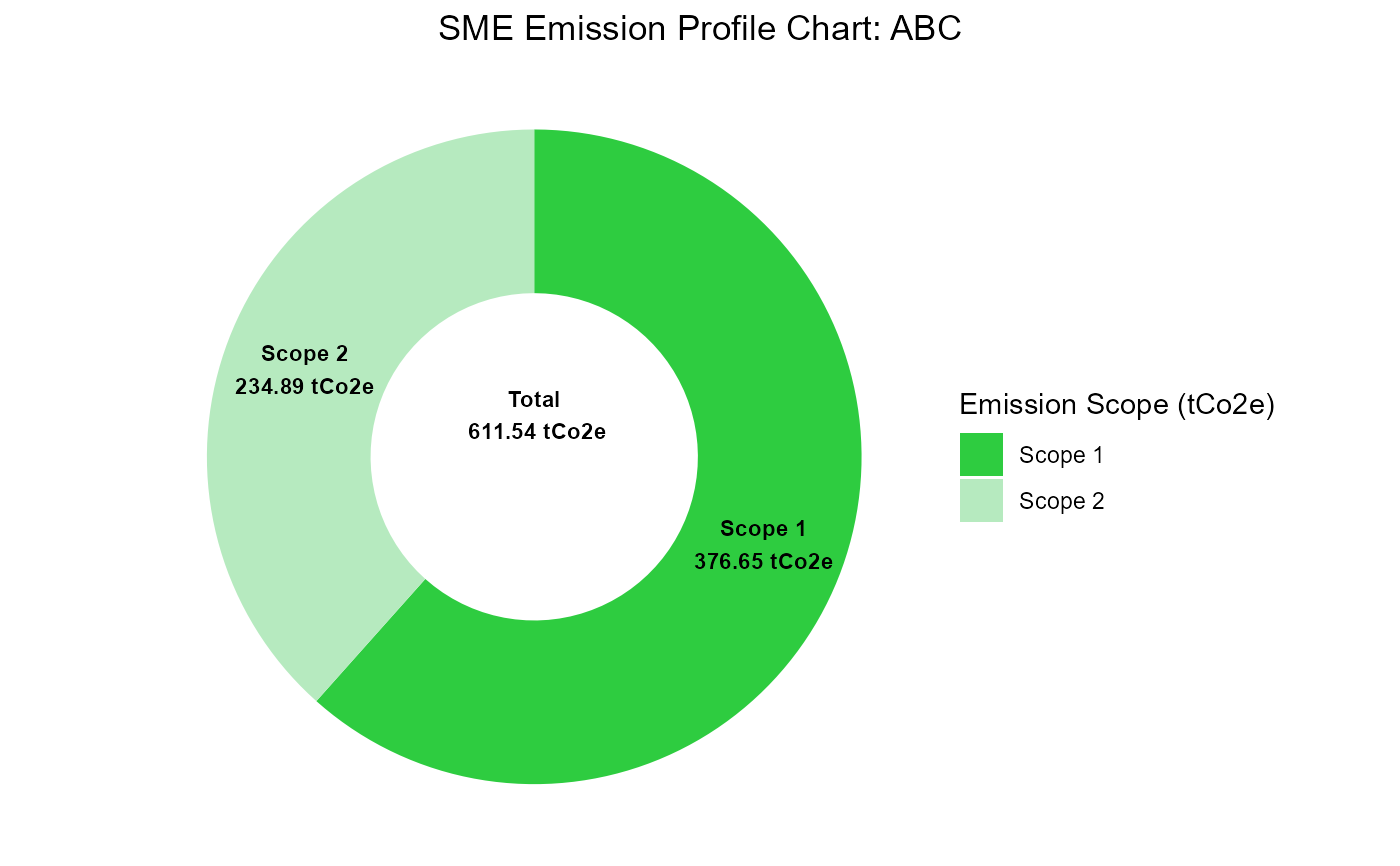
Plot a donut chart of Scope 1,2 and 3 emissions
plot_sme_emissions(
  scope1_emissions,
  scope2_emissions,
  scope3_emissions,
  company_name = NULL
)
Arguments
Value
A ggplot2 donut chart showing predicted emissions for each scope.
Examples
scope_1 = sme_scope1(85, 12000000)
scope_2 = sme_scope2(85, 12000000)
scope_3 = sme_scope3(85, 12000000)
plot_sme_emissions(
scope1_emissions = scope_1$`Predicted Emissions (tCO2e)`,
scope2_emissions = scope_2$`Predicted Emissions (tCO2e)`,
scope3_emissions = scope_3[scope_3$Category == "Total", "Predicted Emissions (tCO2e)"][[1]],
company_name = "Carbon Predict LTD")