Calls the Scope 1, 2 and 3 emissions prediction functions and returns their results as a list and plots a donut chart
sme_emissions_profile(sic_code, turnover, company_name = NULL)Arguments
Value
A list with four elements: scope1, scope2 scope3, scope3_hotspots, each containing the predicted carbon emissions data frame (in tCo2e), the top 5 scope 3 emissions hotspots, as well as a donut chart and Sankey diagram showing the emissions breakdowns.
Examples
sme_emissions_profile(sic_code = 85, turnover = 12000000, company_name = "Carbon Predict LTD")
#> SME Carbon Emissions Profile for Carbon Predict LTD
#> Industry: Education
 #> NULL
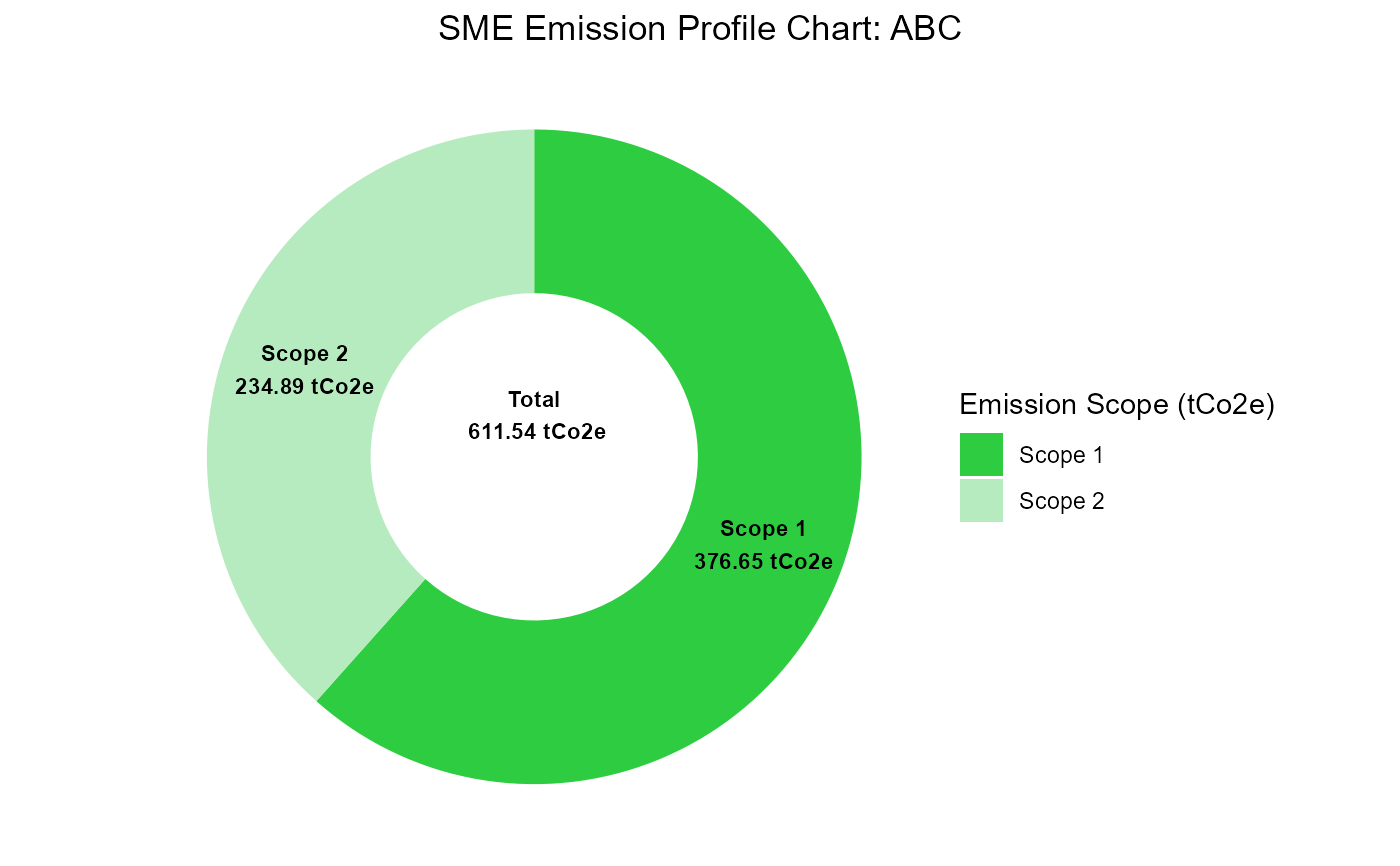
#> $scope1
#> Predicted Emissions (tCO2e)
#> 1 380.92
#>
#> $scope2
#> Predicted Emissions (tCO2e)
#> 1 237.98
#>
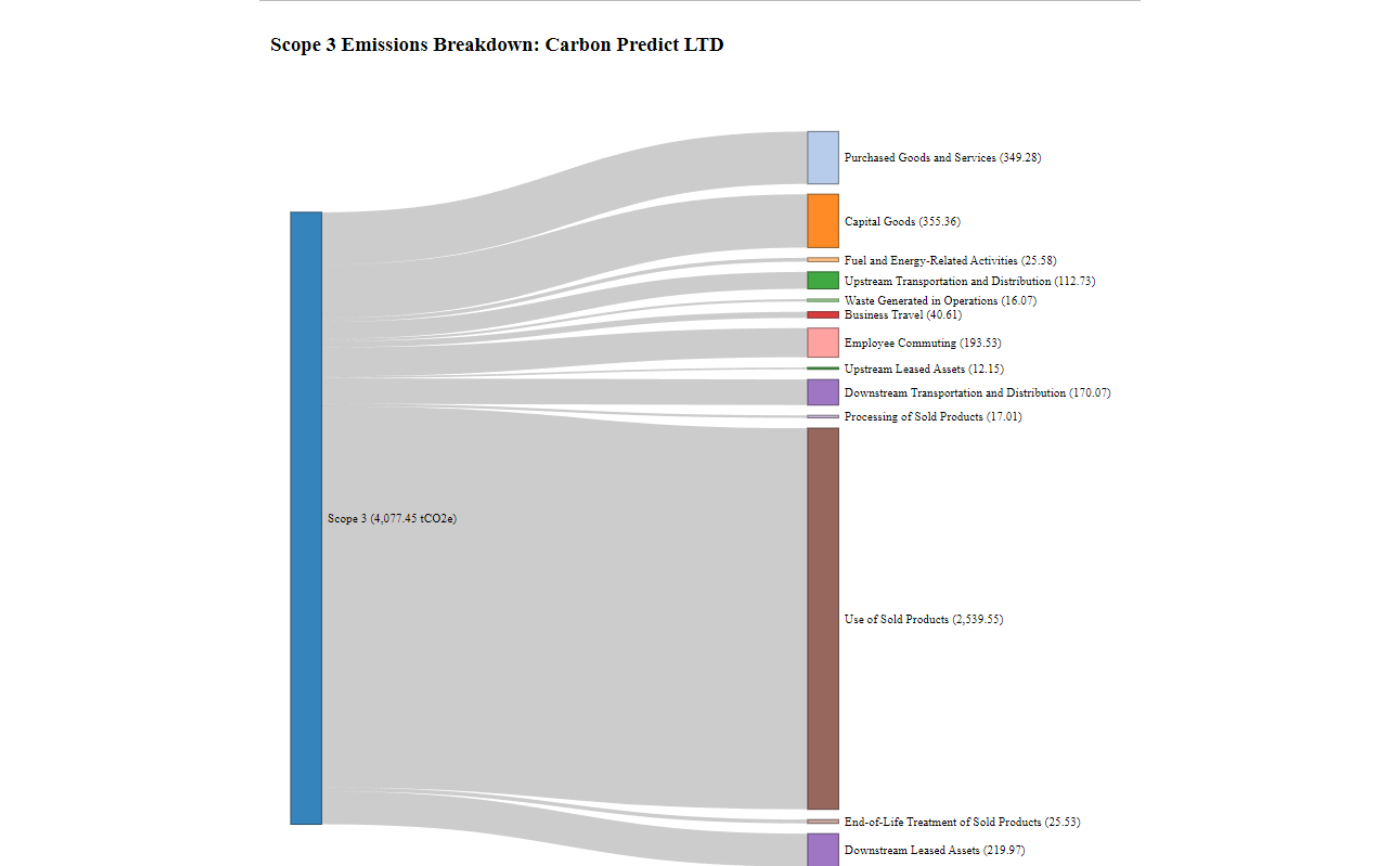
#> $scope3
#> Category Description
#> 1 1 Purchased Goods and Services
#> 2 2 Capital Goods
#> 3 3 Fuel and Energy-Related Activities
#> 4 4 Upstream Transportation and Distribution
#> 5 5 Waste Generated in Operations
#> 6 6 Business Travel
#> 7 7 Employee Commuting
#> 8 8 Upstream Leased Assets
#> 9 9 Downstream Transportation and Distribution
#> 10 10 Processing of Sold Products
#> 11 11 Use of Sold Products
#> 12 12 End-of-Life Treatment of Sold Products
#> 13 13 Downstream Leased Assets
#> 14 Total
#> Predicted Emissions (tCO2e)
#> 1 349.28
#> 2 355.36
#> 3 25.58
#> 4 112.73
#> 5 16.07
#> 6 40.61
#> 7 193.53
#> 8 12.15
#> 9 170.07
#> 10 17.01
#> 11 2539.55
#> 12 25.53
#> 13 219.97
#> 14 4077.45
#>
#> $scope3_hotspots
#> Hotspot Description
#> 1 1 Jobs & Education > Education > Primary & Secondary Schooling (K-12)
#> 2 2 Jobs & Education > Education
#> 3 3 Shopping
#> 4 4 Food & Drink > Food & Grocery Retailers
#> 5 5 Travel > Bus & Rail
#>
#> NULL
#> $scope1
#> Predicted Emissions (tCO2e)
#> 1 380.92
#>
#> $scope2
#> Predicted Emissions (tCO2e)
#> 1 237.98
#>
#> $scope3
#> Category Description
#> 1 1 Purchased Goods and Services
#> 2 2 Capital Goods
#> 3 3 Fuel and Energy-Related Activities
#> 4 4 Upstream Transportation and Distribution
#> 5 5 Waste Generated in Operations
#> 6 6 Business Travel
#> 7 7 Employee Commuting
#> 8 8 Upstream Leased Assets
#> 9 9 Downstream Transportation and Distribution
#> 10 10 Processing of Sold Products
#> 11 11 Use of Sold Products
#> 12 12 End-of-Life Treatment of Sold Products
#> 13 13 Downstream Leased Assets
#> 14 Total
#> Predicted Emissions (tCO2e)
#> 1 349.28
#> 2 355.36
#> 3 25.58
#> 4 112.73
#> 5 16.07
#> 6 40.61
#> 7 193.53
#> 8 12.15
#> 9 170.07
#> 10 17.01
#> 11 2539.55
#> 12 25.53
#> 13 219.97
#> 14 4077.45
#>
#> $scope3_hotspots
#> Hotspot Description
#> 1 1 Jobs & Education > Education > Primary & Secondary Schooling (K-12)
#> 2 2 Jobs & Education > Education
#> 3 3 Shopping
#> 4 4 Food & Drink > Food & Grocery Retailers
#> 5 5 Travel > Bus & Rail
#>